Electric Vehicle Course + Project-based Internship
DIYguru has prepared a one-of-a-kind certification course on Electric Vehicle of 90 Days in partnership with E-Mobility companies. Our programs have been recognized and availed by Robert Bosch, Suzuki, and Hyundai to the name of a few.
International Automotive Safety Standards & Vehicle Homologation
BATTERY ELECTRIC VEHICLE (BEV) TECHNICIAN
HYBRID ELECTRIC VEHICLE (HEV) TECHNICIAN
Certified Electric Vehicle Technician Training Program
DIYguru's Certified Electric Vehicle Technician (CEVT) Training Program is a course designed to equip individuals with the skills necessary to work on electric vehicles (EVs). The program is aimed at students and professionals who want to pursue careers in EV retrofitting, service, repair, and maintenanceNew Course
Advanced EV Engineering: Numerical Analysis, Hybrid Manufacturing, Batteries and Motor Systems
ANSYS Engineering: From Fundamentals to Structural Analysis
Open Source: Battery and Battery Management System
Electric Vehicle Essentials 2: Motors, electrification and charging systems
This course delves into the critical components and systems that power electric vehicles (EVs), with a specific focus on electric motors, vehicle electrification, and charging infrastructure. Participants will acquire a thorough understanding of the technologies and engineering principles that enable efficient and reliable EV performance.Electric Vehicle Essentials 1: Ecosystem, Industry Transition and Technology
This course offers a comprehensive introduction to the electric vehicle (EV) ecosystem, focusing on the pivotal role EVs play in the transition towards sustainable transportation and a low-carbon economy. Participants will gain a deep understanding of the industry dynamics, technological advancements, and regulatory frameworks driving the adoption of electric vehicles globally.Certification Program in Electric Vehicle Modeling and design with SOLIDWORKS
Pre Training Assessment
EV Architecture Modeling using MATLAB Simulink
EV Architecture Modelling
Design of Electric Vehicle
Sensors And Actuators
Practical Training
Introduction to Nano degree
Comprehensive Overview of EV Industry: Safety, Supply Chain, and Manufacturing Processes
Hybrid Vehicle Principles and Heavy-Duty Vehicle Systems
Electric Vehicle Charging Systems and Energy Management Strategies
Electronics and Power Systems in Vehicle Electrification
Essentials of Battery and Motor Technologies in Electric Vehicles
Fundamentals of Electric Vehicle Technology and Industry Transition
Welcome to the Fundamentals of Electric Vehicle Technology and Industry Transition course! In this comprehensive program, we delve into the exciting world of electric vehicles (EVs) and explore the critical shifts happening in the automotive industry. Whether you’re an aspiring engineer, a business professional, or simply curious about the EV revolution, this course provides essential knowledge to navigate this dynamic fieldHYBRID & ELECTRIC VEHICLE REPAIR AND TROUBLESHOOTING
Professional Diploma in Mechatronic and Automation
EV Nanodegree 1st Term Mini Project
Certified Hybrid Electric Vehicle Trainer
Certified Electro Hydraulic Trainer
Professional Certificate in Electro Hydraulic Training
Professional Diploma in Automotive Technician
Hydrogen Fuel Cell Certification Program
Certified Electric Vehicle Technician Training Program (CEVT)
DIYguru's Certified Electric Vehicle Technician (CEVT) Training Program is a course designed to equip individuals with the skills necessary to work on electric vehicles (EVs). The program is aimed at students and professionals who want to pursue careers in EV retrofitting, service, repair, and maintenanceAdvanced EV structural FEA analysis using ANSYS
Electric Vehicle Research & Development(R&D)
Fundamentals of ANSYS (FEA / FEM) Certification Course
Be proficient in using ANSYS software for mechanical engineering problems through ANSYS online training, Learn how to analyze real-world engineering problems using ANSYS simulation software and gain important professional skills sought by employers.Design of Hybrid EV using MATLAB (Project Based) Certification Course
Retrofitment Workshop
Instructor Led Sessions: March
LIVE Sessions: DIYguru – TCS Electric vehicle Technical training
Online course timeline ONLINE COURSE (IN ORDER) S. No Course Name Course Domain Course level Course target 1 EV Certification …Instructor Led Sessions: February
Electric Vehicle Business Certification Course
DIYguru , India's first E-Mobility Learning Platform brings you this course in Electric Vehicle Business Management for Entrepreneurs in this fast-moving Electric Vehicle Market certified by Automotive Skills Development Council, Govt. of India offering a startup and business-friendly course to make you or your organization flourish in this new age of EV market.Electric 2-Wheeler Repairing and Servicing Course (In Hindi) | इलेक्ट्रिक 2-व्हीलर रिपेयरिंग और सर्विसिंग कोर्स
यांत्रिकी के लिए यह इलेक्ट्रिक बाइक/मोटरसाइकिल पाठ्यक्रम इलेक्ट्रिक बाइक और मोटरसाइकिल के साथ काम करने के लिए बुनियादी ज्ञान और …Data Analytics for Automotive Systems Nanodegree Program
About the Nanodegree Program Nanodegree Programs are industry-recognized credential premeditated for students to groove their skills or establish their career. …Instructor Led Sessions: January
Recordings on DIYguru LIVE instructor led sessions.
Electric Vehicle Specialization Course
Instructor Led Sessions: December
Electric Vehicles Advanced Certification Course
The goal of DIYguru and ASDC’s Electric Vehicles Advanced Certification program is to give participants a thorough understanding of the …Analog and Digital Electronics
Arduino Certification Course
Instructor Led Sessions: November
Recordings on DIYguru LIVE instructor led sessions.EV Specialization LIVE classroom recordings
Following course gives the recordings of the lectures for the EV specialization curriculum.Instructor led sessions: October batch
EV LIVE Session recordingsSample LIVE Lectures
Sample LIVE lectures from DIYguru EV Nanodegree programInstructor led sessions: August & September batch
Thus the course is for the DIYguru Nanodegree program, in order to provide them access to the classroom session lecture. …EV Specialisation Crash Course crash course: Maker’s Campaign Season 3.0
Maker’s Campaign Season 3.0 Campaign
An awareness campaign on E-Mobility with Free Training & Online Master's Course in EV to 250 Selected Colleges in India to be held between 4th August 2022 to 30th Dec 2022इलेक्ट्रिक टु-व्हीलर सर्टिफिकेशन कोर्स (मराठी भाषा) Electric Two-Wheeler Certification Course (Marathi Language)
या कोर्समध्ये तुम्ही इलेक्ट्रिक टू-व्हीलर ची ओळख करून द्याल.आपण इलेक्ट्रिक बाईकमध्ये असलेले इलेक्ट्रिक भाग आणि त्यांचे कार्य समजून घ्याल. या कोर्सच्या मदतीने इलेक्ट्रिक बाईकची योग्य देखभाल कशी करावी आणि इलेक्ट्रिक टू-व्हीलरवर दुरुस्ती आणि टू-व्हीलरचा वापर करताना कोणती काळजी घ्यावी आणि इलेक्ट्रिक टू-व्हीलरचे काही सुरक्षा नियम हे आपल्याला पाहायला मिळेल.
DIYguru Instructor led Sessions: August Batch
Thus the course is for the DIYguru Nanodegree program, in order to provide them the access to the classroom session …Electric Vehicle Nanodegree
DIYguru Webinar Sessions
Live webinar technical sessionsDIYguru Instructor led LIVE Sessions
DIYguru regular classroom session accessElectric vehicle System integration
Automotive Embedded System
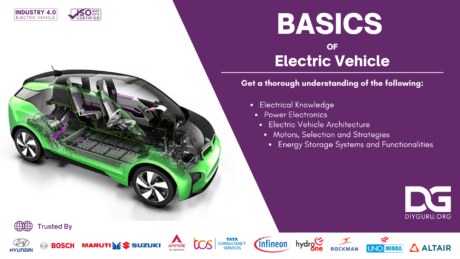
An embedded system is an electronic or computer system which is designed to control, access the data in electronics based systems.Basic of Electrical Engineering for Electric Vehicle Certification Course
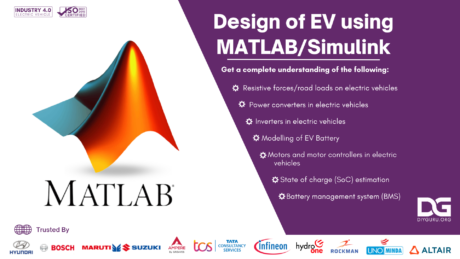
When climate change is the main concern, the most sustainability is needed in the field of the automotive industry in terms of fossil fuel combustion where Electric Vehicle with the shortened acronym as EV took the important alternate option. Design of EV Using MATLAB (including Project-based 1-month Internship program) Certification Course
This program is designed in such a way that it covers all the basic components involved in designing a electric vehicle and to model it in MATLAB/Simulink.
Technical Sales (B2B / B2C) Certification Course
Overview In today’s complex and competitive industrial environment, the sales professionals who succeed are those with great technical sales skills …Three Week DIYguru-Altair : Data Analytics course
DIYguru DIYguru is India’s most prominent and leading EV Technology Course provider accredited by AICTE, ASDC, Digital India Foundation, and …Three Week DIYguru-Altair: Design Course
Overview The global computer-aided design (CAD) software market was valued at $8,325.0 million in 2017 and is predicted to progress …Three Week Internship / Training Program on Electric Vehicle Design & Development
THREE WEEK TRAINING PROGRAM ON ELECTRIC VEHICLE IN COLLABORATION WITH ALTAIR DIYguru DIYguru is India’s most prominent and leading EV …Electric Vehicle Battery Pack Modelling Course (including Project-based 1-month Internship program)
In this course, we’ll take a look at Fundamentals of battery pack design and look at what a battery pack is, what it does and we’ll also explore the individual components that typically make up a battery pack. This program is designed in such a way that every upcoming week one module is uploaded.Altair CAD / CAE Bundle
Get access to the most comprehensive, open architecture CAE simulation platform in the industry, which offers the best technologies to …Autodesk Alias Certification Program
Enrol today to get the most astonishing experience of learning automotive surfacing and rendering using the most popular tool used in the automotive industry that is Autodesk Alias.(NP2001S7): Data Visualization
Visualize the data and make them communicate with others. Plotting and analysing them is the best way to show your analysis and decisions. Once you have worked extensively to analyse your datasets and get reliable results, it is crucial to convey your results and ideas! And so, visualization marks the end of this huge specialization package.(NP2001S6): Data Analytics Intermediate
In this course, students will carry forward the prior experience in the domain of pandas and will work more extensively to analyse datasets. Students will learn to load and store datasets, preparing datasets and transforming data accordingly. This will make students to dive into the heart of data analytics! Where students will actually work in the way, a professional data analyst would perform to analyse datasets.(NP2001S5): Data Analytics Basic: Numpy and Introduction to Pandas
The beginning of the course will cover the PYTHON data structures: tuples, lists, dicts, and sets. With this, the students will be working with defining functions and using their own functions to analyse datasets. Later, students will work on how to import and manage multiple file types. This will help students to work with file systems in Jupyter platform.(NP2001S4): PYTHON Advanced Certification Course
The aim of this course is to make, a sufficient python developed, to work on, and tackle every future task of data analysis and manipulation. The modules have been designed in a way that the student could, in future, develop more interactive and better analytics algorithms in a completely interactive manner. The provided specialization understands the essential skills, and so, shall focus then on the SQL and database concepts. Here the student will understand more about databases, and will work and program multiple database tables with SQL and relevant commands.(NP2001S3): PYTHON Intermediate – Data Structures Certification Course
Working with PYTHON basics will give students to flexibility to upskill and upgrade their PYTHON knowledge to a higher level. This will give you more understanding of analysing and manipulation data with PYTHON concepts in more detail. This course is the next possible course in the specialization of “data analytics in PYTHON” and will cover the intermediate level of PYTHON programming. This course will take the student’s expertise to the next level, where students would be able with more advanced examples and more sophisticated concepts.(NP2001S2): Basics Of PYTHON Certification Course
The course will first introduce the PYTHON programming paradigm and will make students work in the atom development environment. The students will start with the generic terminologies used in the PYTHON programming. Continuing with the same, the students will write their first PYTHON program. Fundamentals of Python & Data Analysis Certification Course
In this course, students will be introduced to the PYTHON programming language and the concept of data analysis. How data analysis has become one of the most important skills for students in different areas. How data analysis and Python, is useful in every domain, ranging from mathematics to physics, from computer science to electrical engineers. Every second company works with data, and so, requires, professionals, who can understand their data and can play with them! This course will bring out the understanding and motivation to start a career in data analysis using PYTHON.PYTHON Programming Language (For Mechanical & Electrical Engineers) Certification Course
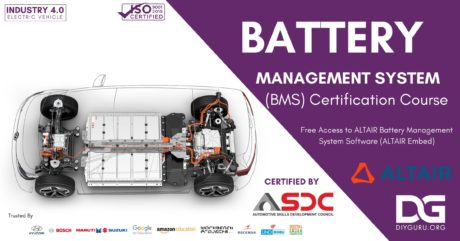
The purpose of these walk-throughs is to give mechanical engineers a vision of how they can use Python in their own area of expertise and understand the scope of what is possible, whether for business or academia. As you walk through the showcase projects in this series you’ll also learn some of the different modes of writing and using python in an engineering environment. This program is designed in such a way that on every upcoming week one module is uploaded.BMS – Battery Management System Certification Course (including Project-based 1-month Internship program) Certification Course
In this course, we'll take a look at Battery Management Systems and look at what a battery management system is, what it does and we'll also explore the individual components that typically make up a battery management system. This program is designed in such a way that on every upcoming week one module is uploaded.Solidworks (Project Based Approch) With One Month Internship Project Certification Course
DIYguru presents the three-week certification program on Electric Bike & Four Wheeler Virtual prototype design course using Solidworks, now with 4-6 weeks of additional internship-based project learning! You will be learning how to make 3D models, 2D engineering drawing, assembly, animation, and high-quality 2-Wheeler and 4-Wheeler Electric Vehicle in SolidWorks.BS VI – Emission Norms and Control Strategies Certification Course
To regulate the pollution emitted by cars and two-wheeler s, the govt of India has put forth regulations referred to as Bharat Stage Emission Standards (BSES). The Central government has mandated that each one vehicle manufacturers, both two-wheelers and four-wheelers, should manufacture, sell and register only BS6 (BSVI) vehicles from 1 April 2020.Understanding Vehicular Pollution & Mitigation Strategies | DIY Course
One of the best tools in the fight against air pollution is education. By educating people on the importance of clean air, what they can do to lower their own emissions, and how to be aware of the air quality in their area, the problem of pollution can be better addressed.DIY Robotics Project Based Certification Course
INTRODUCTION Introduction to robotics Electronics Concepts of electronics Introduction to electronic components LEDs Resistors, Potentiometer, Capacitors, etc Sensors Breadboard Soldering …Autonomous Farming (Agriculture Production Technique)
Within the next decade, farming as we know it is expected to be revolutionized by the use of self-driving tractors and robots that can perform time-consuming tasks now done by humans.Sustainable Energy & Entrepreneurship Course
This course provides students with advanced skills in renewable energy, energy efficiency and business.
The course is designed for students with a background in engineering (such as mechanical engineering, chemical engineering or energy) or science (physics, chemistry, environmental science) or economics.Robocon ABU Challenge
The ABU Asia-Pacific Robot Contest (ABU Robocon) is an Asian Oceanian College robot competition, founded in 2002 by Asia-Pacific Broadcasting Union. In the competition robots compete to complete a task within a set period of time. The contest aims to create friendship among young people with similar interests who will lead their countries in the 21st century, as well as help advance engineering and broadcasting technologies in the region.NASA Mars Rover Challenge
In this course of NASA Human Exploration Rover Challenge, we will be helping students and teams to gather and mentor about imp. aspects of challenges ranging from component procurement to design calculations. The motto is to spread awareness about this competition which features an engineering design challenge to engage students worldwide in the next phase of human space exploration.Hyperloop pod competition
The Hyperloop Pod Competition is an annual competition sponsored by SpaceX in 2015–2019 where a number of students and non-student teams are participating to design—and for some, build—a subscale prototype transport vehicle to demonstrate technical feasibility of various aspects of the Hyperloop concept. The competitions have been open to participants globally, although all competitions and judging has occurred in the United States.Formula SAE Competition (Preparatory Course)
Formula SAE is a student design competition organized by SAE International (previously known as the Society of Automotive Engineers, SAE).
The concept behind Formula SAE is that a fictional manufacturing company has contracted a student design team to develop a small Formula-style race car. The prototype race car is to be evaluated for its potential as a production item. The target marketing group for the race car is the non-professional weekend autocross racer. Each student team designs, builds and tests a prototype based on a series of rules, whose purpose is both ensuring on-track safety (the cars are driven by the students themselves) and promoting clever problem solving.eBAJA SAE Competition | Preparatory Course
eBAJA is an Electric Vehicle Based intercollegiate design competition. Teams of students need to design and build electric-powered ATV that has Traction motor of 48V with fully automatic transmission having 10.83 Gear Ratios and 160 ah of the battery pack.Railway Engineering (Certification Course)
Discover the science and complexity of railway systems, including how their efficiency depends on the alignment of all their components.Composite Materials – Design of Light Weight Materials
This course provides students a background in modern composite materials which are being used in an ever-increasing range of applications and industries. Basic knowledge of composite materials will allow engineers to understand the issues associated with using these materials, as well as gain insight into how their usage differs from conventional materials such as metals, and ultimately be able to use composites to their fullest potential.Product Design & Digital Fabrication | Design Thinking Course
The Product Design and Development program is the only one of its kind course that will provide you with the unique understanding to develop high-tech, ecological and socially responsible products from concept and design to production.National Road Safety Training – Instructor Course
The main objective of this course is to develop highway professionals as "Road Safety Engineers" who should be able to bring in safety engineering elements in design, construction, operation and maintenance stages systematically ensuring safety for the road users.Vehicle Crash Testing using HyperCrash : Online Course
Car companies and suppliers continue to develop new technologies that make vehicles safer and regulatory agencies continue to update safety regulations based on new research studies, making vehicle safety design more and more complex. This seminar covers the mechanics of frontal crashes and how vehicle structures, vehicle restraint systems, and vehicle interiors affect occupant safety. It also describes details of how CAE tools work in the simulation of frontal crashes. The goal of the course is to familiarize participants with engineering principles behind vehicle and restraint designs for occupant safety.Hydrogen Fuel Cell Technology | Course
This course features technical information on the use of hydrogen as a transportation fuel. It covers hydrogen properties, use, and safety as well as fuel cell technologies, systems, engine design, safety, and maintenance. It also presents the different types of fuel cells and hybrid electric vehicles.Space Exploration Online Course (Career Making)
By successfully completing this course, you will acquire the critical tools to understand the key events and developments of the Space Age. You will learn to solve basic technical and engineering problems of space travel, rocket propulsion, space systems, and human space flight.


")

")
")